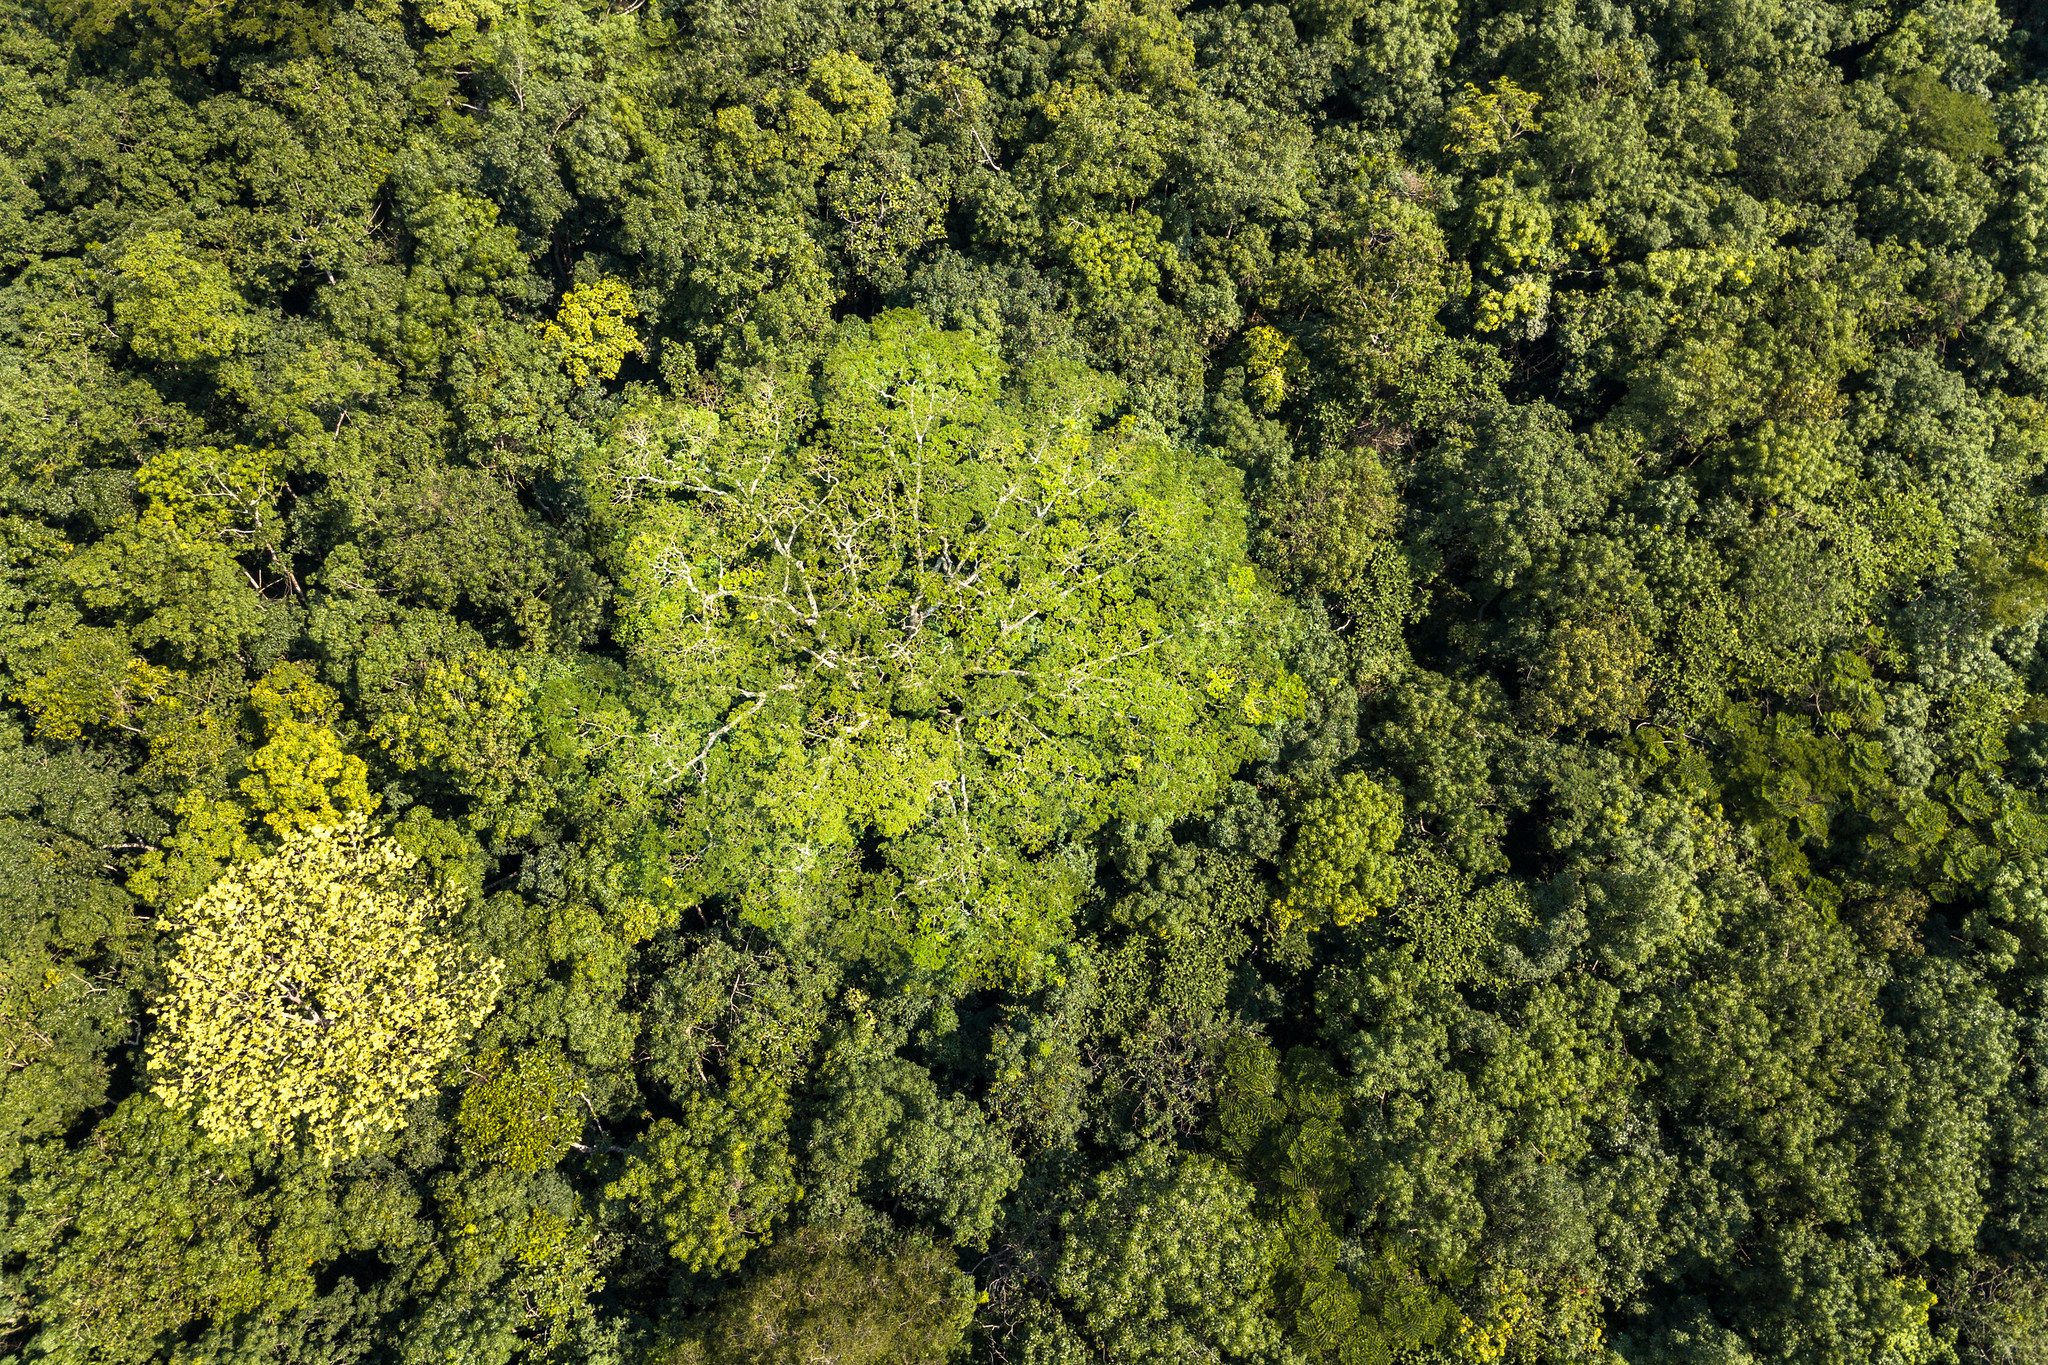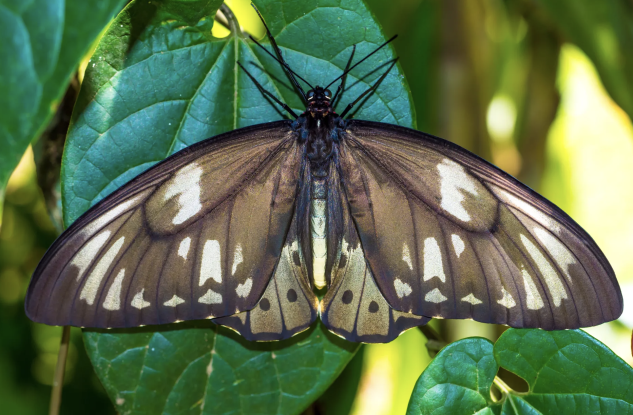
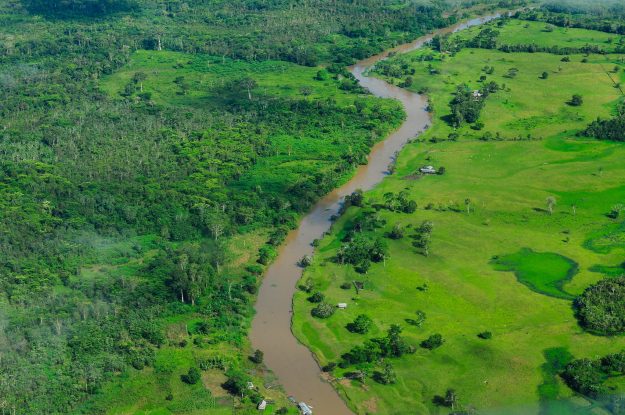


The lowland rainforests of Borneo are some of the most biodiverse places on the planet. Surveys have found over 700 tree species in a single ten-hectare plot — a figure comparable to the tree diversity of entire continents. These forests are home to unique animals like the Bornean orangutan (Pongo pygmaeus), the Bornean clouded leopard (Neofelis diardi) and the sun bear (Helarctos malayanus), and are recognized as a living carbon density hotspot.
Yet an ecological vegetation map developed by scientists at Landscape Alliance, formely known as the Center for International Forestry Research and World Agroforestry (CIFOR-ICRAF), has revealed for the first time just how scarce these forests are becoming. In the Indonesian province of West Kalimantan, intact lowland forest on well-drained mineral soil was estimated to make up about a third of land cover in 1950. The new map shows that in 2024, it covered just 8.3% of the province.
The finding highlights the importance of finer-scale mapping. At the scale still widely used by provincial planners (1:250,000), intact lowland forests are often merged with peatlands, degraded forests, and converted areas into overly broad categories, masking important ecological differences and patterns of degradation. That has serious implications for landscape decision-making.
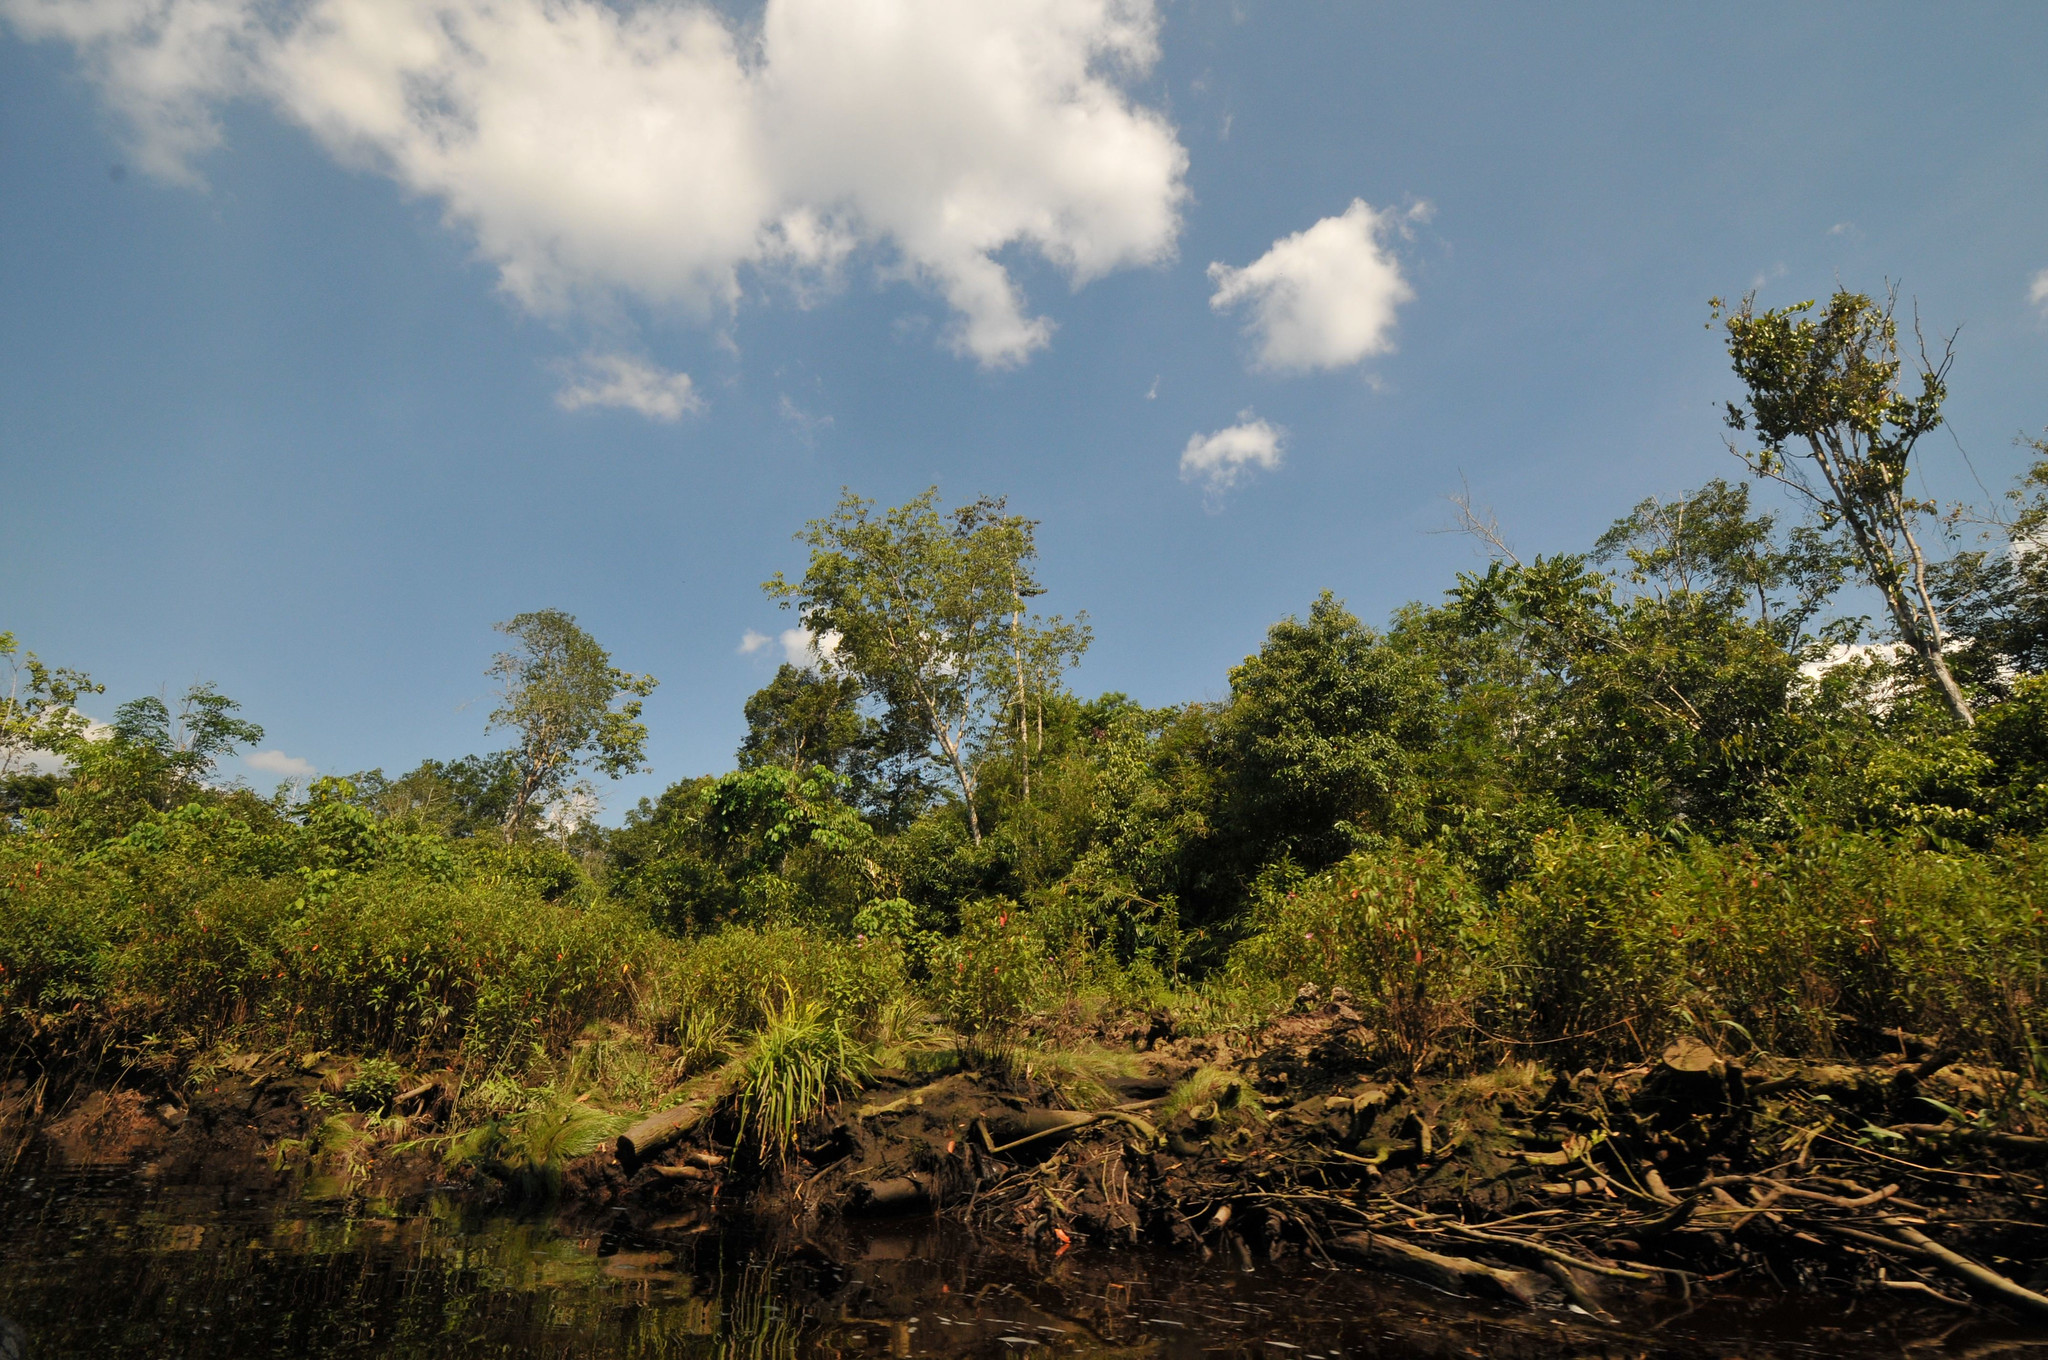
Photo by Nanang Sujana / Landscape Alliance
Beyond the binary
Most land-cover maps address a single question: “forest or non-forest,” says CIFOR senior scientist Yves Laumonier. The West Kalimantan ecological vegetation map — which uses a much finer scale of 1:50,000, and for which there is now a 2014 and a 2024 version — tells a far more nuanced story. Combining satellite data, drone surveys and fieldwork, it integrates information about 54 detailed vegetation types, soil types, hydrology and plant communities.
That helps to answer questions that can’t be resolved at eye level or from further afar. “When you’re on the road and you see a new oil palm field, immediately your brain reads it as a huge area, even though it might not be,” says Laumonier. “Without remote sensing, you really have no reliable assessment.”
The maps also showed that traditional agroforestry systems, including jungle rubber, mixed tree gardens (Tembawang), communal forest gardens (Parua) and remnant forest patches (Pulau) retained tree cover and biodiversity throughout the period.
Field surveys indicated that these systems can support levels of tree species richness comparable to that of old secondary forests, while continuing to provide food security and livelihoods for local communities.
The approach also made it possible to distinguish and spatially represent several ecologically important forest types that had previously remained unmapped, including kerangas and kerapah forests, pole peat swamp forest, and sandstone hill forests. Overall, it revealed much higher ecological heterogeneity within the landscape than conventional land-cover maps had previously shown.
When the map is wrong
The case for finer-scale mapping seems straightforward — especially given that Indonesia’s national government decreed back in 2016 that all new land-use planning should be conducted at 1:50,000.
But most provinces are yet to adopt this finer-scale approach, and that’s having serious ecological consequences. For instance, the ecological vegetation maps show that new oil palm plantations are increasingly expanding onto deep peatlands, despite this being prohibited under Indonesian law. That has contributed to the rapid decline of peat swamp forests over the last decade: in several landscapes, large areas of peat swamp forest present in 2014 had been drained, fragmented, or converted by 2024 — raising major concerns not only for biodiversity, but also for the extremely high carbon emissions associated with degraded peat ecosystems.
“The original official maps are so poor in terms of [showing where peat is] that local governments, when we tell them they’ve opened land for oil palm in a peat swamp, they’ll show us an old official map saying there is no peat in that area,” says Laumonier. “Even if the map is wrong, it’s the official map, so they say they have no reason not to open the land.”
Mapping for everyone
The resistance to finer-scale mapping may soon become untenable. The ecological vegetation maps are free to download and are already proving extremely popular.
“When we decided to do the revision, ten years after the original, we were very surprised to realise how often it had been accessed,” said Laumonier. “My colleague said it had been accessed 70,000 times. I thought it must be a mistake, that it should be 7,000. But it really was 70,000. There were also many requests from colleagues and people working in forestry and agriculture, who were always wondering if there was a new version.”
But the most significant shift may not be for scientists or planners.
For decades, coarse-scale mapping rendered many local management systems effectively invisible, including agroforestry landscapes, customary territories, and community land claims embedded within forest mosaics. Finer-scale ecological and participatory mapping is now helping to better recognize these important and unique social-ecological landscapes.
Frequent cloud cover over the island makes consistent satellite data difficult to obtain, but drones can fly at any time, and Laumonier says their sensor quality is now comparable to that of satellite imagery at a fraction of the cost.
For communities trying to uphold land tenure and protect their territories against extractive practices, that’s a serious step up from the participatory sketch maps used in the past, which were often dismissed by local government as unofficial. Drone-assisted community maps, produced at 1:50,000 scale and aligned to the government’s own topographic grid, have the potential to be far more legally meaningful, says Laumonier.
“It becomes a much more powerful document for communities to defend their land.”